
Light Tower Charging Time: Charger Power and Battery Size
Calculate light tower charging time from usable battery energy, actual charger power and state of charge. Compare AC and off-grid solar replenishment with a field-check method.
Light tower charging time depends on the energy missing from the battery, the power the charger can actually deliver, and the battery-management limits near a full charge. Divide the missing energy in kilowatt-hours by effective charging power in kilowatts for a first estimate, then add time for conversion losses and the slower finishing stage. A solar or wind-powered tower needs a different calculation: available charging energy changes hour by hour with weather and load. Do not infer an overnight recharge promise from battery capacity or a solar-panel nameplate alone. This guide shows a reproducible estimate for fleet planning without attributing an unverified charging specification to any particular Keyyou model.
First identify what “charging time” means
A procurement sheet may use the phrase for three different intervals: time connected to an AC supply, daylight required to replenish an off-grid battery, or time from one operating state of charge to another. Ask whether lighting remains on during the interval. If lamps consume power while a charger operates, only the net remainder enters the battery. A comparison between two machines is meaningful only when the starting and ending state of charge, charger setting, ambient temperature, and simultaneous load are stated.
The U.S. Department of Energy notes that charging duration depends on battery depletion, capacity, the onboard charger and available electrical service in its electric charging overview. Although its examples concern vehicles, the same energy and power accounting applies to a portable battery system; the hardware and charging curves of a light tower must still be verified separately. A practical fleet target might be a defined usable operating window such as 20% to 90% state of charge, not necessarily an arbitrary 0% to 100% cycle.
Calculate the energy that must return to the battery
Start with the battery’s usable energy, rather than assuming the entire nominal nameplate capacity is accessible. If the manufacturer supplies usable capacity directly, use that number. Otherwise, request the allowed state-of-charge window and confirm whether the displayed percentage refers to nominal or usable energy. The simple relationship is:
Energy to restore (kWh) = usable battery capacity (kWh) × (target SOC − starting SOC), where SOC values are fractions from zero to one. The corresponding ideal time is energy to restore divided by charging power, but real input energy is higher because electrical conversion and battery processes are not lossless. The Department of Energy’s battery energy storage evaluation method distinguishes charging and discharging power and measured capacity; this is why a field estimate should use measured energy where available.
For a transparent illustrative calculation, not a Keyyou product specification, suppose a fleet battery has 10 kWh usable capacity and starts at 25% SOC. Charging to 85% restores 10 × (0.85 − 0.25) = 6 kWh inside the battery. If the charging path averages 2 kW into the battery during that interval, the energy-only minimum is 3 hours. If 2 kW is an AC-input rating rather than measured battery-side power, the time will be longer. The final interval may also be slower if the battery-management system reduces current as the battery approaches its upper limit.
Which power rating should you put in the denominator?
The smallest constraint in the charging chain governs the practical rate: the site supply, wiring and protection, charger input and output, battery-management limit, or a deliberately reduced mode. A charger may be described in watts at its AC input, watts at its DC output, amperes at a specified voltage, or simply by a model code. These are not interchangeable. Multiplying a verified DC voltage by current gives an approximate instantaneous DC power, but the battery voltage and current may change during the cycle. Request an actual charge curve or measured AC energy and battery SOC trace for reliable scheduling.
| Item to confirm | Why it changes the estimate | Anzufordernde Beweismittel |
|---|---|---|
| Usable battery capacity | Nominal nameplate energy may exceed the permitted operating window | Usable kWh and SOC limits for the specified battery |
| Start and target SOC | A partial refill is shorter than a complete charge | Logged percentages and how SOC is calculated |
| Charger output and site supply | The weakest rated part limits sustained power | Approved input, DC output, connector and charge curve |
| Lighting during charging | Operating lamps subtract from net battery charge | Simultaneous-use policy and measured lamp demand |
| Temperature and controls | Protection or thermal management may reduce current | Permitted charging temperature and derating behavior |
| Solar or wind contribution | Generation varies with weather, shading and time of day | Site-specific hourly energy estimate or monitored history |
Do not silently treat the nominal rating as a constant. If a 2 kW charger is limited to a lower output for part of the cycle, divide energy by the average battery-side power over the chosen SOC range. A longer scheduled charging slot is an operational allowance, not evidence that a manufacturer guarantees a fixed number of hours. State your assumptions in a fleet sheet so dispatchers know when the estimate ceases to apply.
AC charging versus solar replenishment
For a confirmed plug-in configuration, AC charging is usually the easier case to plan because power can be measured while connected to a compatible source. Verify that the particular product has an approved charger and input connector; a line item reading “AC input” on a product page does not by itself establish a charging function. Do not improvise a direct mains-to-battery connection. The configuration, charger, protection and supply need approval by the manufacturer and the site’s qualified electrical personnel.
For an off-grid wind-solar model, distinguish calendar time from effective charging hours. A solar array rated at a given output under test conditions will not deliver that output continuously from sunrise to sunset. Actual production depends on solar resource, panel orientation, shading, weather, temperature and system losses. The national laboratory’s PVWatts calculator illustrates why location, orientation and losses belong in an energy-production estimate, although its grid-connected assumptions should not be copied uncritically to a mobile off-grid trailer. Wind contribution needs local wind data and the specified turbine/controller characteristics; it should not be added as guaranteed constant power.
Use an hourly energy balance: estimated generation minus lighting and control loads, then apply measured charging losses and battery limits. A sunny day might restore more energy than the night shift used, while poor weather might not. The related guide to Energiebilanz eines mobilen Solar-Lichtmasts covers daily generation and consumption; our article on cloudy-weather planning addresses reserve. This charging-time article answers the narrower question of how long a specified refill takes under known inputs.
A field procedure that produces a defensible answer
- Record the starting condition. Note date, temperature, battery SOC, whether lights are running, and any alarms. If the unit has rested after a shift, record that distinction.
- Identify the approved source. Confirm the model-specific charging mode, charger and supply rating from the manufacturer’s documentation. Do not assume a solar-only model can accept AC charging.
- Measure delivered energy. With suitable approved metering, log AC input energy or controller-reported battery energy, plus timestamps and SOC readings at regular intervals. Only qualified personnel should instrument electrical circuits.
- Compare the same SOC interval. A result from 30% to 80% cannot be compared with a 10% to 100% claim. Repeat after a representative night-shift load and in conditions relevant to your deployment.
- Build a scheduling margin from observations. The required operating reserve, variable weather and possible current taper belong in dispatch planning; no single universal multiplier is valid for every chemistry or charger.
For outdoor site power, inspect flexible cords and connectors before use and select properly rated equipment for the location. OSHA’s guidance on use of portable electrical equipment calls for inspection and location-appropriate equipment. Site-specific electrical rules and the tower manufacturer’s instructions take precedence over a generic online formula. Do not operate a charger or connector in a condition for which it has not been approved.

Common reasons an observed refill takes longer
First, the battery may begin at a lower SOC than the dispatch sheet assumes. Readout calibration can also drift with temperature and current; the battery state-of-charge guide explains what that percentage can and cannot tell you. Second, a charger may taper near the upper SOC limit or reduce power under a protective condition. Third, lights or auxiliary controls may stay active during charging. Fourth, an AC circuit or extension cord may not support the expected charger setting. Fifth, solar panels may be shaded, dirty, unfavorably angled or in poor weather. These causes require different fixes; simply specifying a larger battery does not cure them.
Temperature deserves its own check. A battery-management system may limit charging when a battery is too cold or too hot, and any heating or cooling accessory can consume part of the available energy. Never bypass such a limit to meet a timetable. Compare the observed behavior with the approved operating range and the light tower battery thermal-management guide. If the measured charge rate is suddenly unlike its baseline, inspect logs and refer the problem to qualified service personnel instead of guessing at a failed cell.
What to request before ordering a fleet
Ask the supplier for the exact battery option and usable kWh, approved charge sources, charger input and DC output, connectors, SOC window, ambient charging limits, expected charge curve, and whether lighting can remain on during the charge. For off-grid work, request panel configuration, controller behavior, representative site generation and contingency for consecutive poor-weather days. A meaningful acceptance test defines the starting SOC, target SOC, temperature, supply and lamp operating state. Obtain results in kWh and hours, not only a single brochure number.
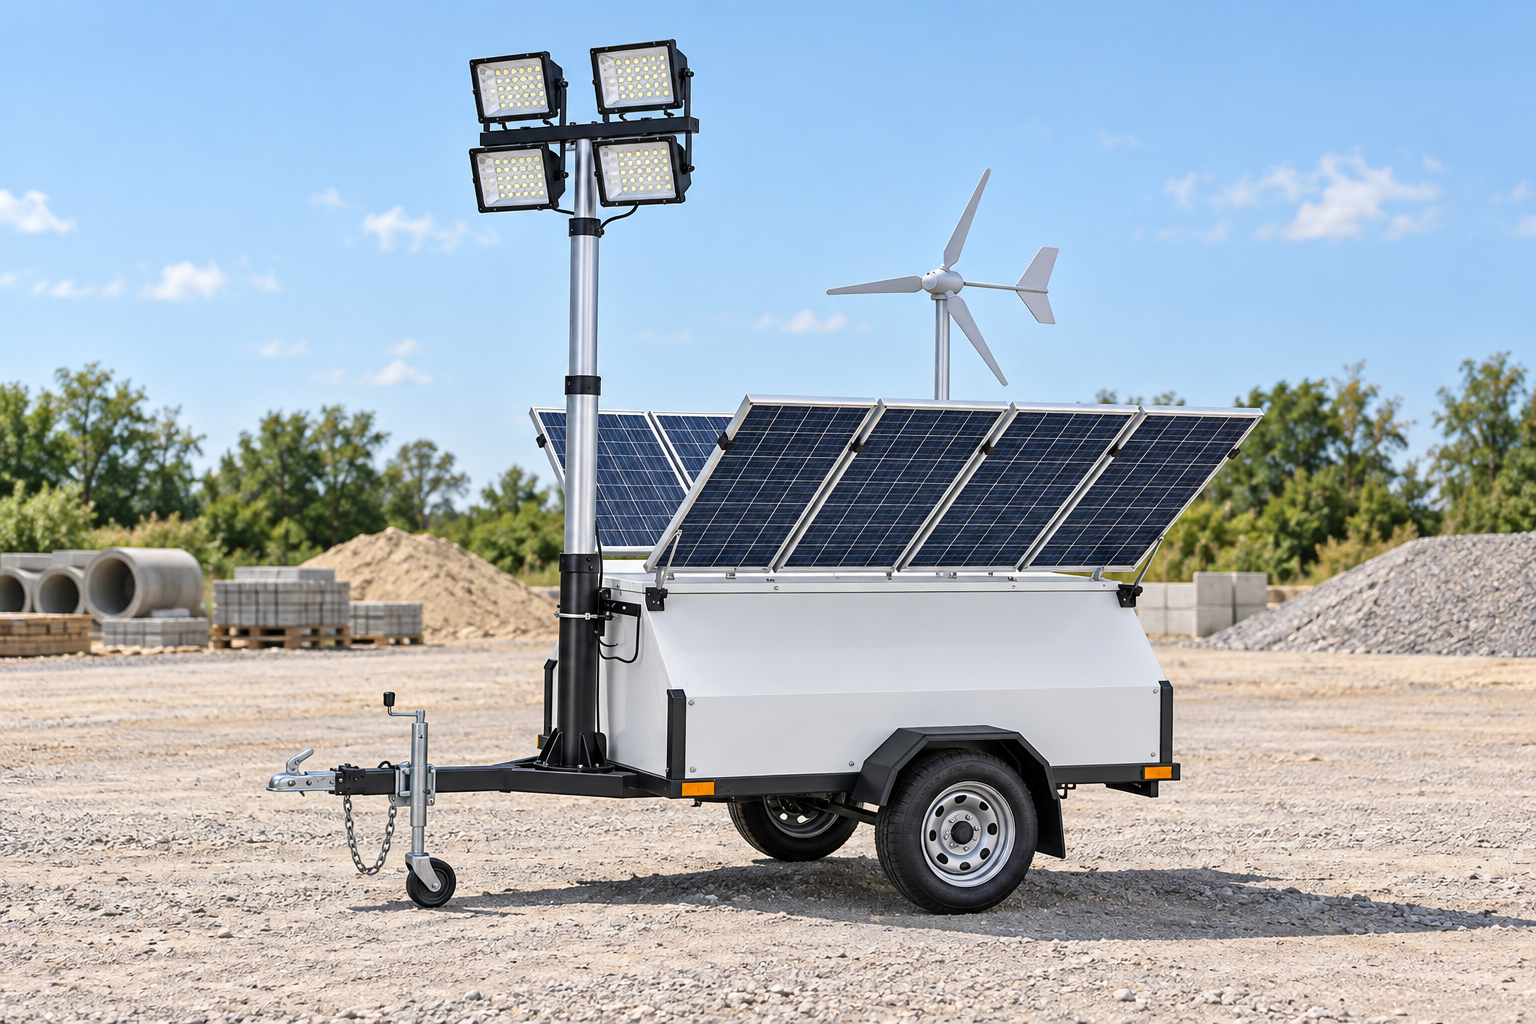
Keyyou’s wind-solar hybrid trailer lighting tower is an example of the relevant product category with solar, wind and battery components. Its listed configurations vary; this article does not state that every version has a specific AC charger, a fixed battery size or a guaranteed refill time. Provide your actual duty cycle and intended charging source when asking for a configuration. That keeps the charging-time estimate connected to the unit you will receive.
Further learning: estimating solar energy before setting a refill schedule
The laboratory video below demonstrates the PVWatts inputs used to estimate photovoltaic output. It is useful background for a solar charging forecast, not a charge-time guarantee for a portable light tower.

Watch the PVWatts tutorial on YouTube.
Häufig gestellte Fragen
Can I calculate charging time from battery size alone?
No. You also need starting and target SOC, usable rather than merely nominal capacity, actual charger or generation power, simultaneous load and the charging curve. Battery size describes stored energy, not the rate at which it can be restored.
Does doubling charger power always halve charging time?
Only in an ideal constant-power interval where the battery and supply accept the extra power. A real charger may hit a battery-management limit or taper near full charge, so the observed reduction can be smaller.
How many hours does a solar light tower need to recharge?
There is no site-independent number. Estimate the missing battery energy and the hourly net solar or wind energy after lighting loads and losses. Check the worst relevant month and maintain an operating reserve for poor-weather days.
Should a light tower be charged to 100% before every shift?
Follow the exact battery and charger instructions for the supplied configuration. Fleet scheduling can use a defined SOC operating window, but the appropriate upper and lower limits vary by battery chemistry, controls and duty cycle; do not impose a generic percentage as a manufacturer requirement.