
Electric Light Tower Runtime Calculator: Load, Losses, and Reserve
Estimate electric light tower runtime from usable battery energy, actual lighting load, conversion losses and reserve. See a worked example and field checklist.
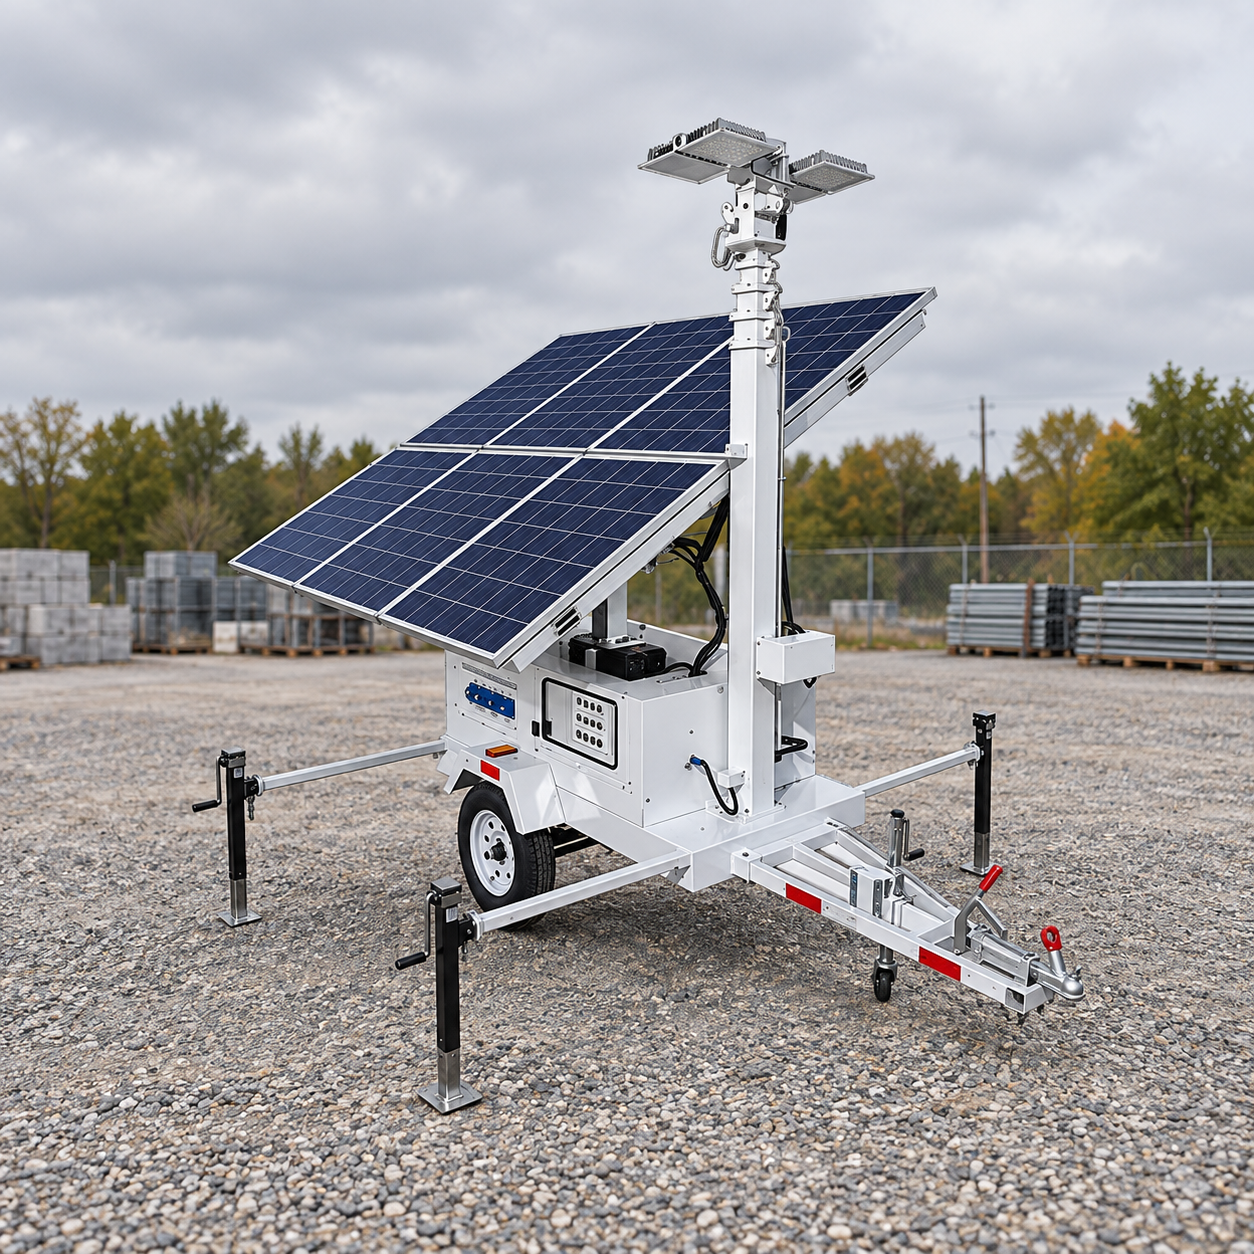
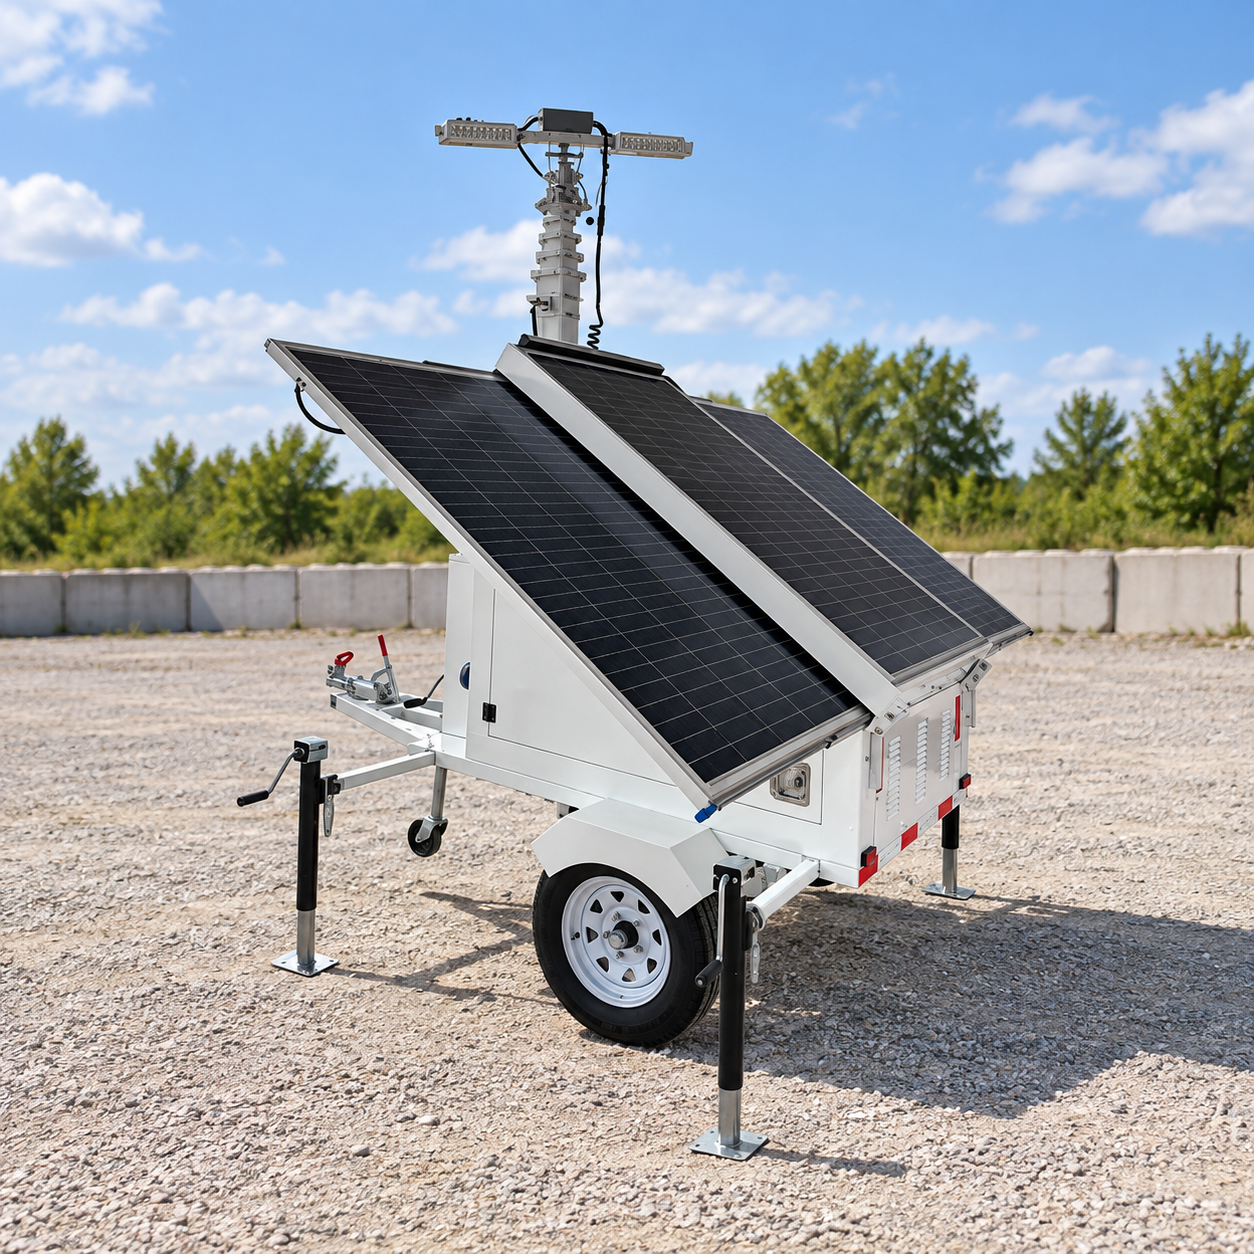
An electric light tower runtime calculator starts with energy that the battery can actually deliver, not the largest number printed on a solar panel or the LED nameplate. Estimate usable battery kilowatt-hours, subtract a deliberate reserve, allow for electrical losses and divide by the measured average load in kilowatts. For a solar-assisted tower, do a separate daylight energy balance; never credit the nighttime schedule with uncertain sunshine. This guide gives a transparent spreadsheet-ready formula, a worked example and a commissioning check. Its sample values are hypothetical, not specifications for the pictured Keyyou tower.
The short formula: usable energy divided by average demand
For a battery-only night with a reasonably steady load, estimated operating hours = available battery energy (kWh) × delivery efficiency ÷ average electrical load (kW). Available energy is the battery’s beginning energy minus the minimum energy you want to retain at shutdown. If you begin below full charge, do not silently use the rated pack capacity. If an inverter’s efficiency varies with loading, use an efficiency value appropriate to the actual duty point, not an optimistic peak figure. The U.S. Department of Energy’s battery energy storage evaluation method distinguishes demonstrated capacity and efficiency from an assumed nameplate value.
A useful calculator has separate input fields for tested capacity, beginning state of charge, minimum permitted state of charge, delivery efficiency, lamp demand, auxiliary demand and planned hours. The minimum is an operating decision within the battery manufacturer’s limits; it is not a suggestion to override a battery management system. Some systems specify usable kWh directly. In that case, avoid subtracting a depth-of-discharge allowance for a second time. Confirm whether the provided number is gross, usable at the DC bus or usable at the AC output before applying more losses.
| Calculator input | Meaning and units | Where to verify it |
|---|---|---|
| Measured battery capacity | Energy available at the specified test condition, kWh | Battery datasheet or commissioning test |
| Starting and minimum SOC | Fraction of charge available for this shift | Controller log and battery manual |
| Delivery efficiency | Combined conversion and wiring efficiency at load | Inverter data or measured DC/AC energy |
| Average LED load | Actual power at selected dimming setting, kW | Power meter and lighting schedule |
| Auxiliaries | Controls, fans, communications and other loads, kW | Metered duty-cycle average |
| Reserve | Energy held back for uncertainty and battery protection | Site risk and manufacturer operating limits |
Worked example with explicitly hypothetical values
Suppose a hypothetical battery has 12.0 kWh of verified capacity at its relevant temperature. It begins a night at 90% state of charge, while the agreed minimum is 20%. The energy window is 12.0 × (0.90 − 0.20) = 8.4 kWh at the measurement basis used for that capacity. Assume a hypothetical 90% combined delivery efficiency at this load: 8.4 × 0.90 = 7.56 kWh reaching the electrical demand. If the selected LED setting averages 0.72 kW and controls and auxiliaries add 0.08 kW, total demand is 0.80 kW. Dividing 7.56 by 0.80 gives about 9.45 hours. This is an illustrative estimate, not a guarantee of nine hours for any Keyyou product.
If the job requires a ten-hour shift, the example falls short before considering aging, cold, dust, a longer-than-planned work period or increased brightness. Do not round 9.45 up to ten. Add a documented reserve by selecting a larger appropriate battery option, reducing a verified load without compromising illumination, using a qualified recharge source or revising the operating schedule. A 10% contingency applied to the energy demand is not the same mathematical operation as arbitrarily reducing runtime by ten percent; state which convention your team uses. For an RFQ, calculate under both expected and unfavorable but credible conditions.
Here is an easy spreadsheet form: nightly load energy (kWh) = Σ(power for each operating interval in kW × hours in that interval). A dimmed tower at 0.5 kW for four hours and 0.8 kW for six hours consumes 6.8 kWh before any relevant conversion losses. A single average of 0.68 kW over ten hours yields the same result, but only if the duty periods and auxiliary loads are included correctly. Validate the actual illuminance requirement at the work plane before changing a dimming setting just to make the arithmetic pass.
Separate the battery night from the solar day
A solar panel has a power rating under defined test conditions. Multiplying that rating by every daylight hour assumes ideal irradiance throughout the day and ignores shading, temperature, orientation, conversion and battery acceptance. DOE’s solar and storage overview explains the distinction between power capacity and stored energy. The National Laboratory of the Rockies’ PVWatts tool helps estimate photovoltaic production for a location, but an actual mobile array’s position, tilt, deployment and local shading still matter. A trailer parked beside a container at sunset may collect far less than an unobstructed estimate.
Use a second calculation: next-day ending energy = morning energy + measured or realistically forecast energy accepted by the battery − daytime loads. Then compare it with the starting energy required for the following night. Account for charging limits: a battery near full charge may not accept all available solar output, while cold or hot conditions may constrain charging. If the tower has an approved auxiliary power option, model it as a separate documented source with its own input capacity and safety procedure. Do not assume the pictured electric-assist configuration has a particular inlet, charger power or battery size; ask for the exact supplied configuration.
For a three-night job, run the balance night by night. A seemingly adequate first night can deplete the reserve if the next two days are overcast. Our cloudy-weather planning guide addresses poor-harvest scenarios; this calculator focuses on the electrical quantities and field verification that make the estimate auditable.
Losses and reserves that are easy to miss
First determine where each measurement is taken. A DC battery capacity figure and an AC lamp power reading straddle the inverter, so conversion losses matter. If both capacity and consumption are already measured at the same delivered AC boundary, applying inverter losses again would double-count them. Wiring loss is usually modest in an intact engineered system but should not be guessed away when cables or connectors differ from the approved configuration. The controller itself draws power. Cooling fans, remote communication devices and warning lamps can add an auxiliary load over many hours.
Battery performance is affected by temperature, age, discharge rate and the protection system’s cutoff threshold. Use the battery maker’s curves for the intended operating environment rather than treating nameplate kWh as invariant. Record the lowest credible starting SOC after transport and setup. Then reserve energy for unexpected extension, not an arbitrary fixed percentage presented as a universal standard. Our battery thermal-management guide deals with temperature controls, while the charging-time guide deals with replenishment. They are connected but different procurement questions.
Lighting demand can change significantly between modes. Meter the exact count of LED heads, dimming program, auto-on/off controls and any auxiliary receptacle use. An extra work light or tool charger should not be hidden inside a vague “typical consumption” claim. If a specification provides only lumens and not electrical watts, do not manufacture a watt value from it. Ask for a measured consumption table by setting and, when relevant, a compatible illumination plan. The resulting calculator is a planning model whose accuracy improves with a controlled site test.
A commissioning test that can correct the estimate
- Record the supplied model and option. Photograph the product identification and obtain battery usable-energy, charger and LED load documentation.
- Start at a known SOC. Confirm how the controller reports SOC and whether it has had time to settle after charging.
- Measure the real lighting program. Log power or energy for each brightness phase and auxiliary circuit without changing site safety requirements.
- Operate through a representative night. Record start/end SOC, operating hours, ambient temperature and any automatic dimming or cutoff.
- Compare energy in and out. Use a consistent DC or AC boundary. Investigate large differences before promising future runtime.
- Repeat after a poor solar day. An ideal clear-day test alone does not validate a multi-night off-grid promise.
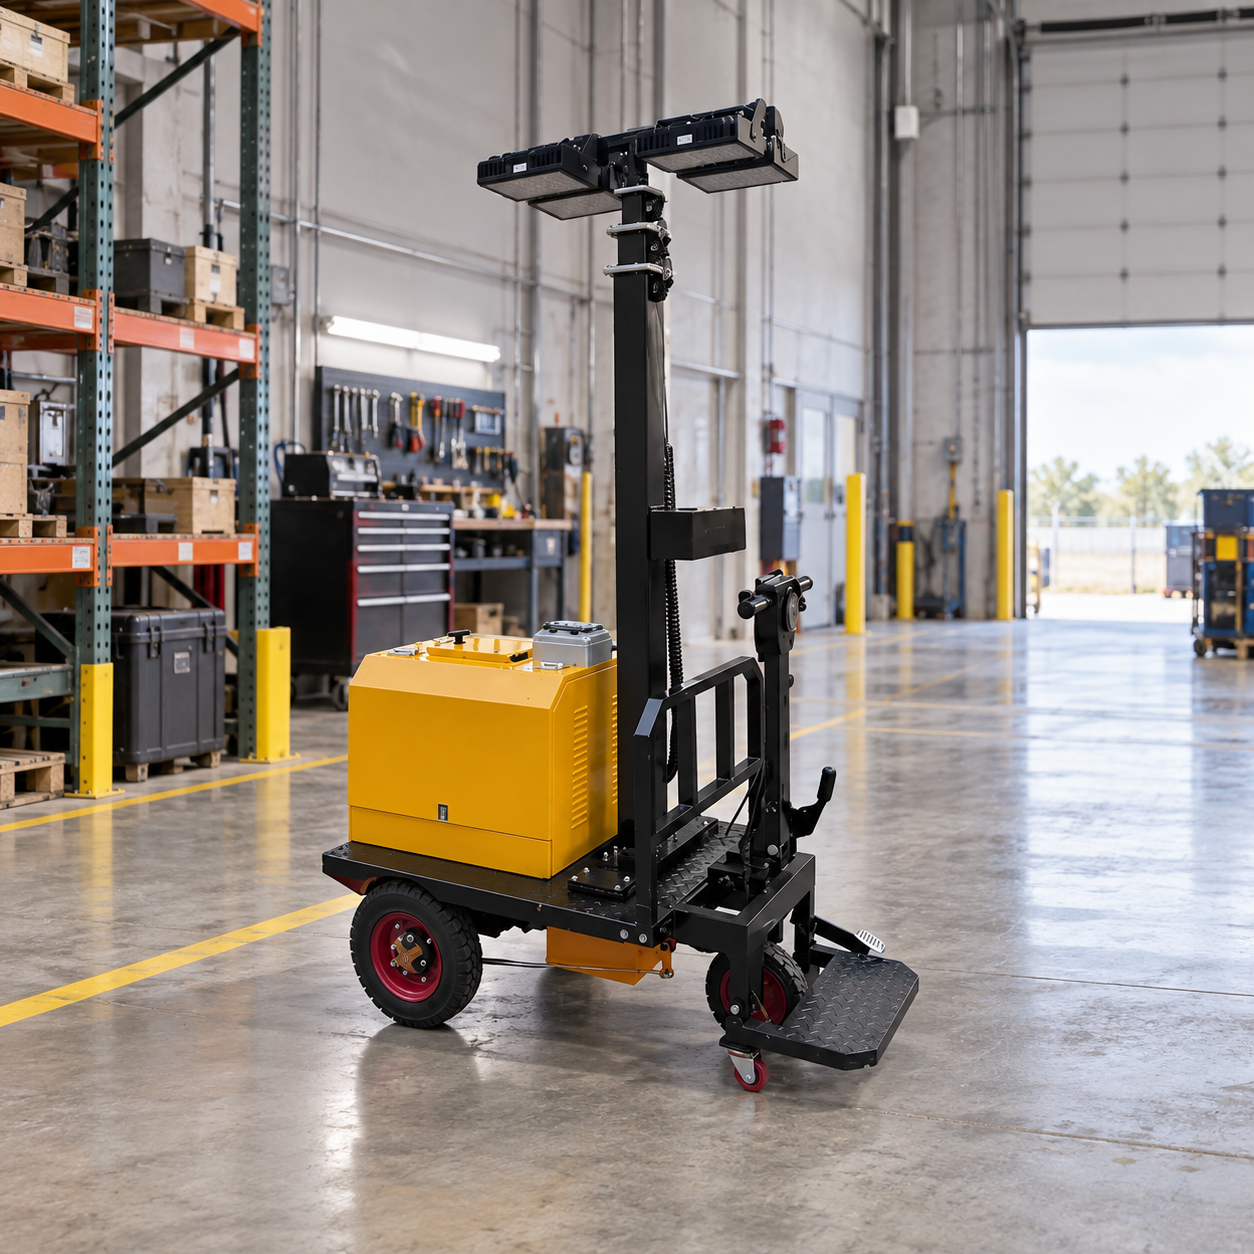
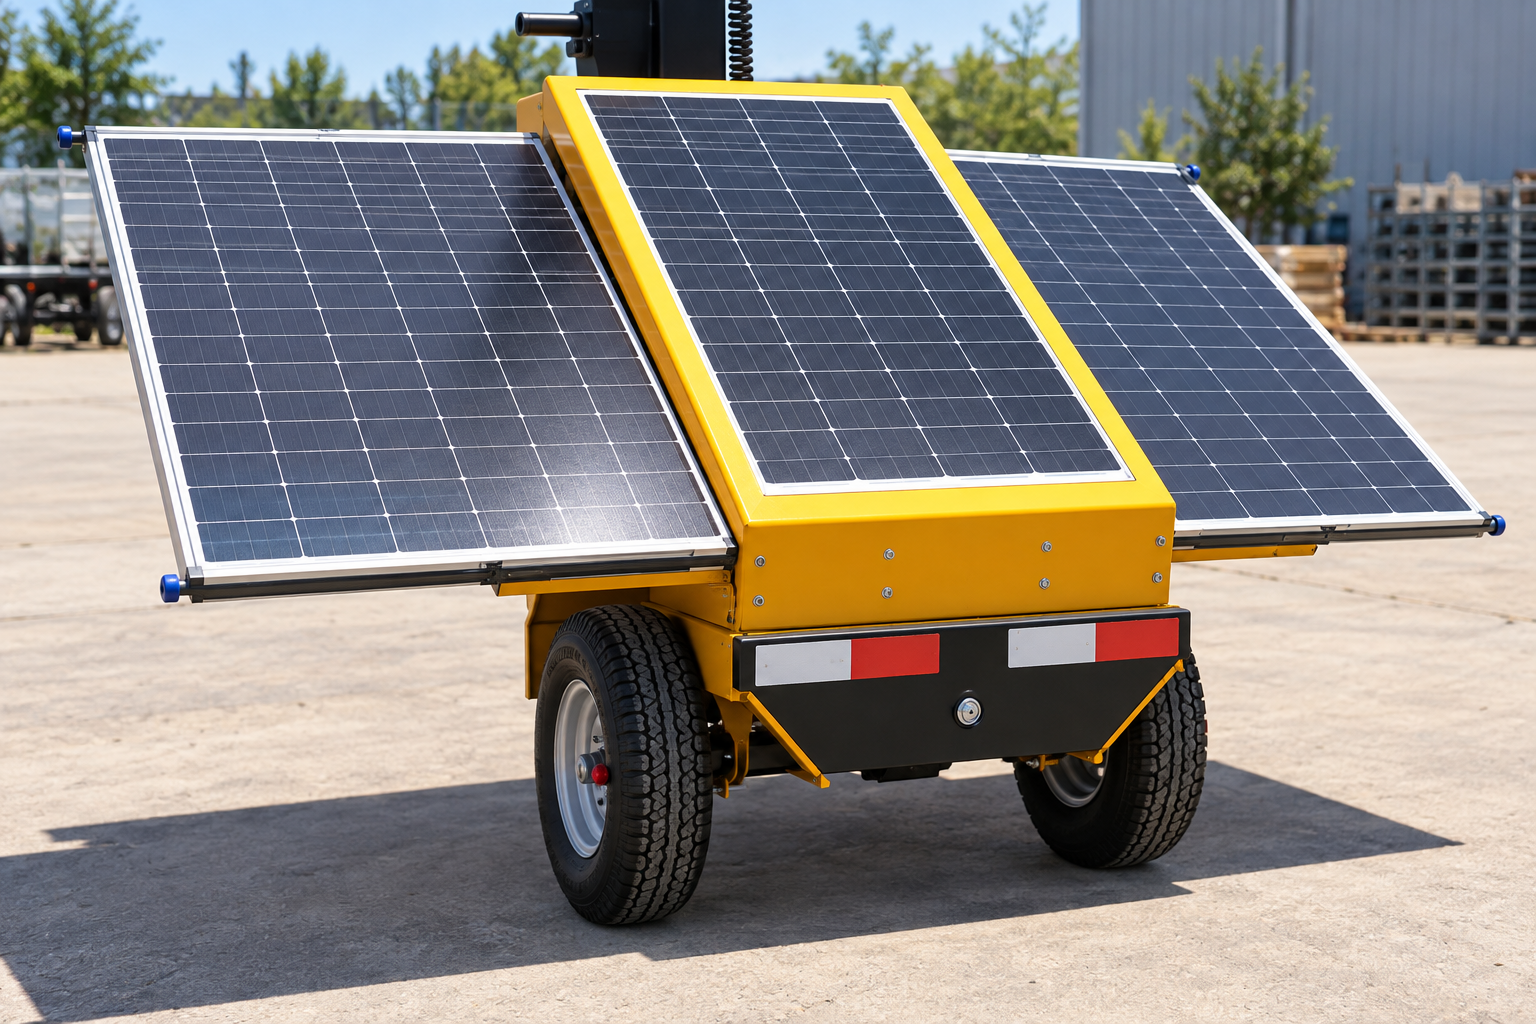
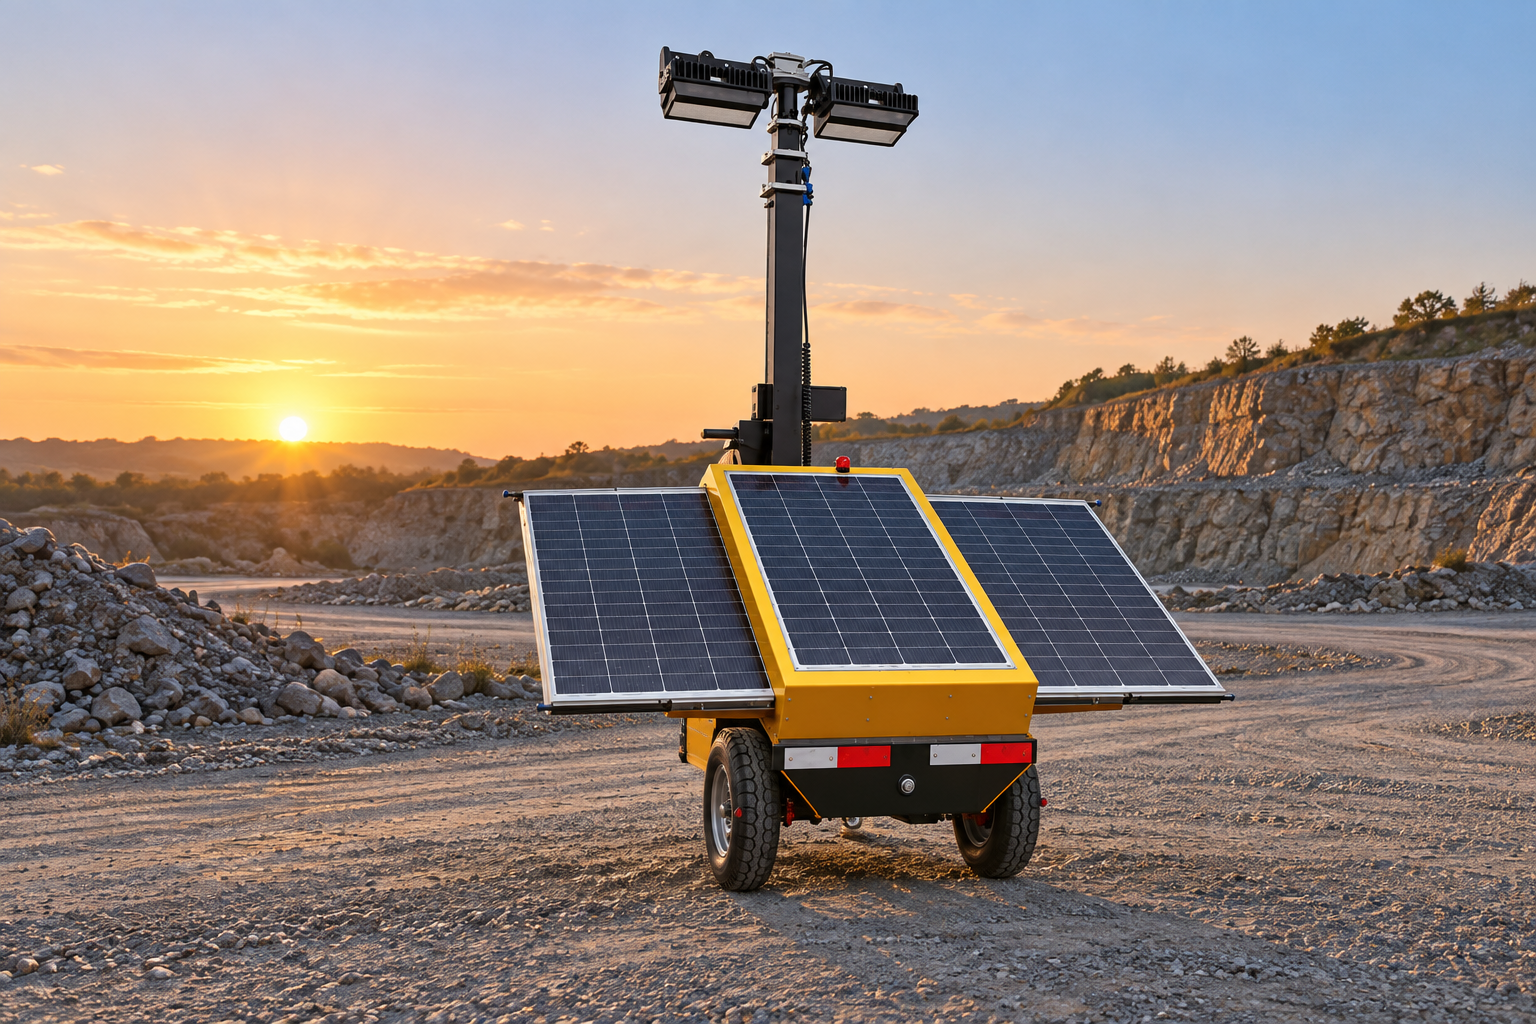
For the Keyyou electric-assist solar light tower, the visual reference shows a yellow two-wheel chassis, three solar panel sections and two rectangular LED heads. Those facts ground the imagery, but they do not supply the measured capacity, delivered efficiency or illumination setting needed to fill the calculator. Request option-specific data and run the site test before committing to a shift duration. If the system is modified, remeasure rather than carrying forward results from a different battery, lamp or controller configuration.
Educational video: estimating solar input
The National Laboratory of the Rockies’ PVWatts introduction helps explain location-dependent solar estimates. It does not calculate the nighttime runtime of this tower by itself; pair solar yield with the battery and load balance above.

Watch the PVWatts educational video.
Häufig gestellte Fragen
Can I divide rated battery kWh by LED nameplate watts?
Only as a rough ceiling. Use the actual starting and minimum SOC, measured load including auxiliaries, and applicable delivery losses. Nameplate and usable energy can differ.
Should I add daytime solar production to the nighttime battery figure?
Only when the time intervals actually overlap and a measured or defensible modeled contribution exists. For a night shift, first calculate battery-only runtime, then model the next day’s recharge separately.
What happens if I dim the lights to extend runtime?
Lower measured electrical demand can extend runtime, but only if the resulting lighting still meets the work area’s safety and task requirements. Verify illuminance and the controller’s real power draw.
Is the worked 9.45-hour value a product specification?
No. Every value in the example is hypothetical. Obtain the exact tower option’s capacity and load data, then validate them on site.